Description:
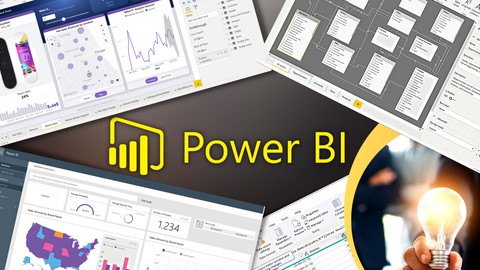
Welcome to our Power BI tutorial, Microsoft’s Business Intelligence tool that allows you to transform raw data into interactive and insightful visualizations. Whether you are a student, a professional, or a data enthusiast, this guide will help you master the basics of Power BI to create impressive dashboards.
Important note
You can get the complete guide for free by contacting us using the email address presented in the promotional video in the ” announcement section”
Objectives:
– Understand the fundamental concepts of Power BI.
– Learn to import data from various sources.
– Create custom visualizations for your data.
– Build interactive and informative dashboards.
Prerequisites:
This tutorial does not require any prior experience with Power BI. However, a basic understanding of data management and analysis would be beneficial.
Target Audience:
This tutorial is suitable for students, professionals, and anyone interested in creating interactive dashboards for data analysis.
Estimated Duration:
The time required to complete this tutorial will depend on your current skill level, but it is expected to take approximately 4 to 6 hours to cover all the content.
Get ready to follow our step-by-step instructions and create impactful visualizations that will help you make informed decisions. By the end of this tutorial, you’ll be able to turn data into actionable insights, which is an essential skill in the modern professional world. Start now!


